In general, a Bézier curve is a polynomial expression used to describe a curve. They are commonly used in computer graphics software, but they may not always be called anything more than a curve. Generally, the user selects two endpoints and one or two control points. A Bézier curve with one control point is called a quadratic Bézier curve and the kind with two control points is called cubic.
Cubic and Quadratic Bézier Curves
This example is based on the description at Wikipedia. A and C are the start and end points, B is the control point. The points D and E are each half way along AB and BC, respectively. The midpoint of DE is marked F, F is on the curve. This pattern can be repeated with A, F and D then F, C and E to get more points on the curve. The process repeats infinitely for math, but only as far as our eyes can see for SVG.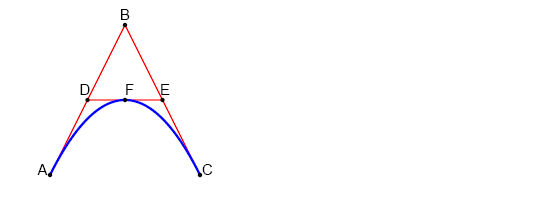
<!DOCTYPE svg PUBLIC "-//W3C//DTD SVG 1.1//EN" "http://www.w3.org/Graphics/SVG/1.1/DTD/svg11.dtd">
<svg viewBox = "0 0 1100 400" version = "1.1">
<!-- Constructing the curve -->
<!-- Construction line from start to control -->
<path id = "lineAB" d = "M 100 350 l 150 -300" stroke = "red" stroke-width = "3" fill = "none"/>
<!-- Construction line from control end -->
<path id = "lineBC" d = "M 250 50 l 150 300" stroke = "red" stroke-width = "3" fill = "none"/>
<!-- Construction line from midpoint to midpoint -->
<path id = "lineBC" d = "M 175 200 l 150 0" stroke = "red" stroke-width = "3" fill = "none"/>
<!-- The quadratic Bézier curve -->
<path id = "quadcurveABC" d = "M 100 350 q 150 -300 300 0" stroke = "blue" stroke-width = "5" fill = "none"/>
<!-- Annotation -->
<!-- Mark the relevant points -->
<g stroke = "black" stroke-width = "3" fill = "black">
<circle id = "pointA" cx = "100" cy = "350" r = "3"/>
<circle id = "pointB" cx = "250" cy = "50" r = "3"/>
<circle id = "pointC" cx = "400" cy = "350" r = "3"/>
<circle id = "pointD" cx = "175" cy = "200" r = "3"/>
<circle id = "pointE" cx = "325" cy = "200" r = "3"/>
<circle id = "pointF" cx = "250" cy = "200" r = "3"/>
</g>
<!-- Label the points -->
<g font-size = "30" font = "sans-serif" fill = "black" stroke = "none" text-anchor = "middle">
<text x = "100" y = "350" dx = "-30">
A
</text>
<text x = "250" y = "50" dy = "-10">
B
</text>
<text x = "400" y = "350" dx = "30">
C
</text>
<text x = "175" y = "200" dx = "-10" dy = "-10">
D
</text>
<text x = "325" y = "200" dx = "10" dy = "-10" text-anchor = "middle">
E
</text>
<text x = "250" y = "200" dy = "-10" text-anchor = "start">
F
</text>
</g>
</svg>
Describing Cubic Bézier Curves in SVG
Cubic Bézier curves are a little more difficult to get than quadratics. From Wikipedia:
Four points A, B, C and D in the plane or in three-dimensional space define a cubic Bézier curve. The curve starts at A going toward B and arrives at D coming from the direction of C. In general, it will not pass through B or C; these points are only there to provide directional information. The distance between A and B determines "how long" the curve moves into direction B before turning towards D.
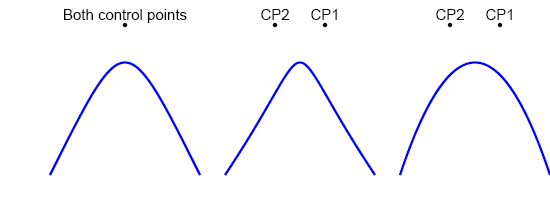
In the example below, the leftmost curve has both control points where the
previous example had just one. The middle curve has the control points spread
50 units to the right and left of the earlier point. The far right curve uses
the same control points as the middle curve, but their order is reversed. It
takes some experimentation to get a feel for Bézier curves.
<!DOCTYPE svg PUBLIC "-//W3C//DTD SVG 1.1//EN" "http://www.w3.org/Graphics/SVG/1.1/DTD/svg11.dtd">
<svg viewBox = "0 0 1100 400" version = "1.1">
<!-- The cubic Bézier curve -->
<path id = "cubiccurveABBC" d = "M 100 350 c 150 -300 150 -300 300 0" stroke = "blue" stroke-width = "5" fill = "none"/>
<path id = "cubiccurveABBC" d = "M 450 350 c 200 -300 100 -300 300 0" stroke = "blue" stroke-width = "5" fill = "none"/>
<path id = "cubiccurveABBC" d = "M 800 350 c 100 -300 200 -300 300 0" stroke = "blue" stroke-width = "5" fill = "none"/>
<!-- Annotation -->
<!-- Mark the control points -->
<g stroke = "black" stroke-width = "3" fill = "black">
<!-- left curve has identical control points -->
<circle cx = "250" cy = "50" r = "3"/>
<!-- middle curve control points -->
<circle cx = "650" cy = "50" r = "3"/>
<circle cx = "550" cy = "50" r = "3"/>
<!-- right curve control points -->
<circle cx = "900" cy = "50" r = "3"/>
<circle cx = "1000" cy = "50" r = "3"/>
</g>
<!-- Label the points -->
<g font-size = "30" font = "sans-serif" fill = "black" stroke = "none" text-anchor = "middle">
<text x = "250" y = "50" dy = "-10">
Both control points
</text>
<text x = "650" y = "50" dy = "-10">
CP1
</text>
<text x = "550" y = "50" dy = "-10">
CP2
</text>
<text x = "900" y = "50" dy = "-10">
CP2
</text>
<text x = "1000" y = "50" dy = "-10">
CP1
</text>
</g>
</svg>