The last circle on the previous page is actually filled by
a gradient. Gradients
and Patterns are called "Paint Servers" in SVG.
Colours are also called "Paint Servers." This
probably doesn't matter to you.
The way to make a gradient in SVG is with either a
linearGradient or radialGradient element. I'll call both
of these gradient elements. The gradient element needs to
contain colours to stop at along with the positions that
these colours should show up in. Between the stop colours,
the colour of the gradient will change from the colour at one
stop to the colour at the other stop. Outside the bounds of
the first and last stop, the behaviour of the gradient is
defined by the spreadMethod attribute of the gradient
element. The default value is "pad" which keeps the
colour of the nearest stop. The values "reflect"
and "repeat" allow you to make an infinite triangle
wave or sawtooth wave (respectively).
The easiest way to understand mapping a linear gradient is to
think of a graphics program where you've used a two
colour linear gradient fill. Generally, you draw a line and
the gradient starts where you started drawing and ends where
you finished drawing. Getting into the nitty-gritty parts,
I'm saying that the point you clicked to start gets
coloured with the first colour of the gradient. The point
where your line ends gets the second colour. In between the
two points there are stripes of all the blends of the two end
colours (like the shades of pink if one end is white and the
other is red). All the "stripes" will be
perpendicular to the line you drew.
A linearGradient is located with the points (x1,y1) and
(x2,y2). These can be given as percentages or coordinates. I
recommend percentages. This automatically scales the shape
you're filling to the range 0 to 100 on both the x and y
axes. Using a percentage for the offset values in your stops
makes that part simple as well. The length of the line is
scaled that way from 0 (the start of the gradient) to 100
(the end). The math just goes to sin at that point.
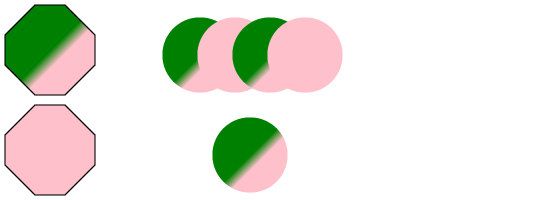
Here's an easy example:
Gradient Example
<!DOCTYPE svg PUBLIC "-//W3C//DTD SVG 1.1//EN" "http://www.w3.org/Graphics/SVG/1.1/DTD/svg11.dtd">
<svg viewBox = "0 0 1100 400" version = "1.1">
<defs>
<polygon id = "s1" points = "60,0 120,0 180,60 180,120 120,180 60,180 0,120 0,60" stroke = "black" stroke-width = "3"/>
<polygon id = "s2" points = "60,0 120,0 180,60 180,120 120,180 60,180 0,120 0,60" stroke = "black" stroke-width = "3"/>
<circle id = "s3" cx = "100" cy = "100" r = "75"/>
<circle id = "s4" cx = "100" cy = "100" r = "75"/>
<linearGradient id = "g1" x1 = "50%" y1 = "50%" x2 = "60%" y2 = "60%">
<stop stop-color = "green" offset = "0%"/>
<stop stop-color = "pink" offset = "100%"/>
</linearGradient>
<radialGradient id = "g2" cx = "100" cy = "100" r = "50">
<stop stop-color = "green" offset = "0%"/>
<stop stop-color = "pink" offset = "100%"/>
</radialGradient>
<symbol id = "ps1" fill = "cornflowerblue" color = "cornflowerblue"/>
</defs>
<use x = "10" y = "10" xlink:href = "#s1" fill = "url(#g1)"/>
<use x = "10" y = "210" xlink:href = "#s2" fill = "url(#g2)"/>
<use x = "300" y = "10" xlink:href = "#s3" fill = "url(#g1)"/>
<use x = "370" y = "10" xlink:href = "#s3" fill = "url(#g2)"/>
<use x = "440" y = "10" xlink:href = "#s3" fill = "url(#g1)"/>
<use x = "510" y = "10" xlink:href = "#s3" fill = "url(#g2)"/>
<use x = "400" y = "210" xlink:href = "#s4" fill = "url(#g1)"/>
</svg>
Suppose I have a box that's 50x50 with a top left corner at 25,25. I want a gradient fill to make diagonal stripes on my box from corner to corner. I could specify my gradient as going from 25,25 to 75,75. Now suppose I shrink the box a little. My gradient will get messed up. Instead I could just specify my gradient as going from (0%,0%) to (100%,100%).

<!DOCTYPE svg PUBLIC "-//W3C//DTD SVG 1.1//EN" "http://www.w3.org/Graphics/SVG/1.1/DTD/svg11.dtd">
<svg viewBox = "0 0 1100 400" version = "1.1">
<defs>
<rect id = "r1" width = "350" height = "350" stroke = "black" stroke-width = "1"/>
<linearGradient id = "g1" x1 = "0%" y1 = "0%" x2 = "100%" y2 = "100%">
<stop stop-color = "black" offset = "0%"/>
<stop stop-color = "white" offset = "100%"/>
</linearGradient>
</defs>
<use x = "325" y = "25" xlink:href = "#r1" fill = "url(#g1)"/>
</svg>
Adding a third colour in the middle doesn't take a lot of thinking when using percentages for coordinates.

<!DOCTYPE svg PUBLIC "-//W3C//DTD SVG 1.1//EN" "http://www.w3.org/Graphics/SVG/1.1/DTD/svg11.dtd">
<svg viewBox = "0 0 1100 400" version = "1.1">
<defs>
<rect id = "r1" width = "350" height = "350" stroke = "black" stroke-width = "1"/>
<linearGradient id = "g1" x1 = "0%" y1 = "0%" x2 = "100%" y2 = "100%">
<stop stop-color = "black" offset = "0%"/>
<stop stop-color = "teal" offset = "50%"/>
<stop stop-color = "white" offset = "100%"/>
</linearGradient>
</defs>
<use x = "325" y = "25" xlink:href = "#r1" fill = "url(#g1)"/>
</svg>